An Object-Centered Data Acquisition Method for 3D Gaussian Splatting using Mobile Phone

📝

Abstract

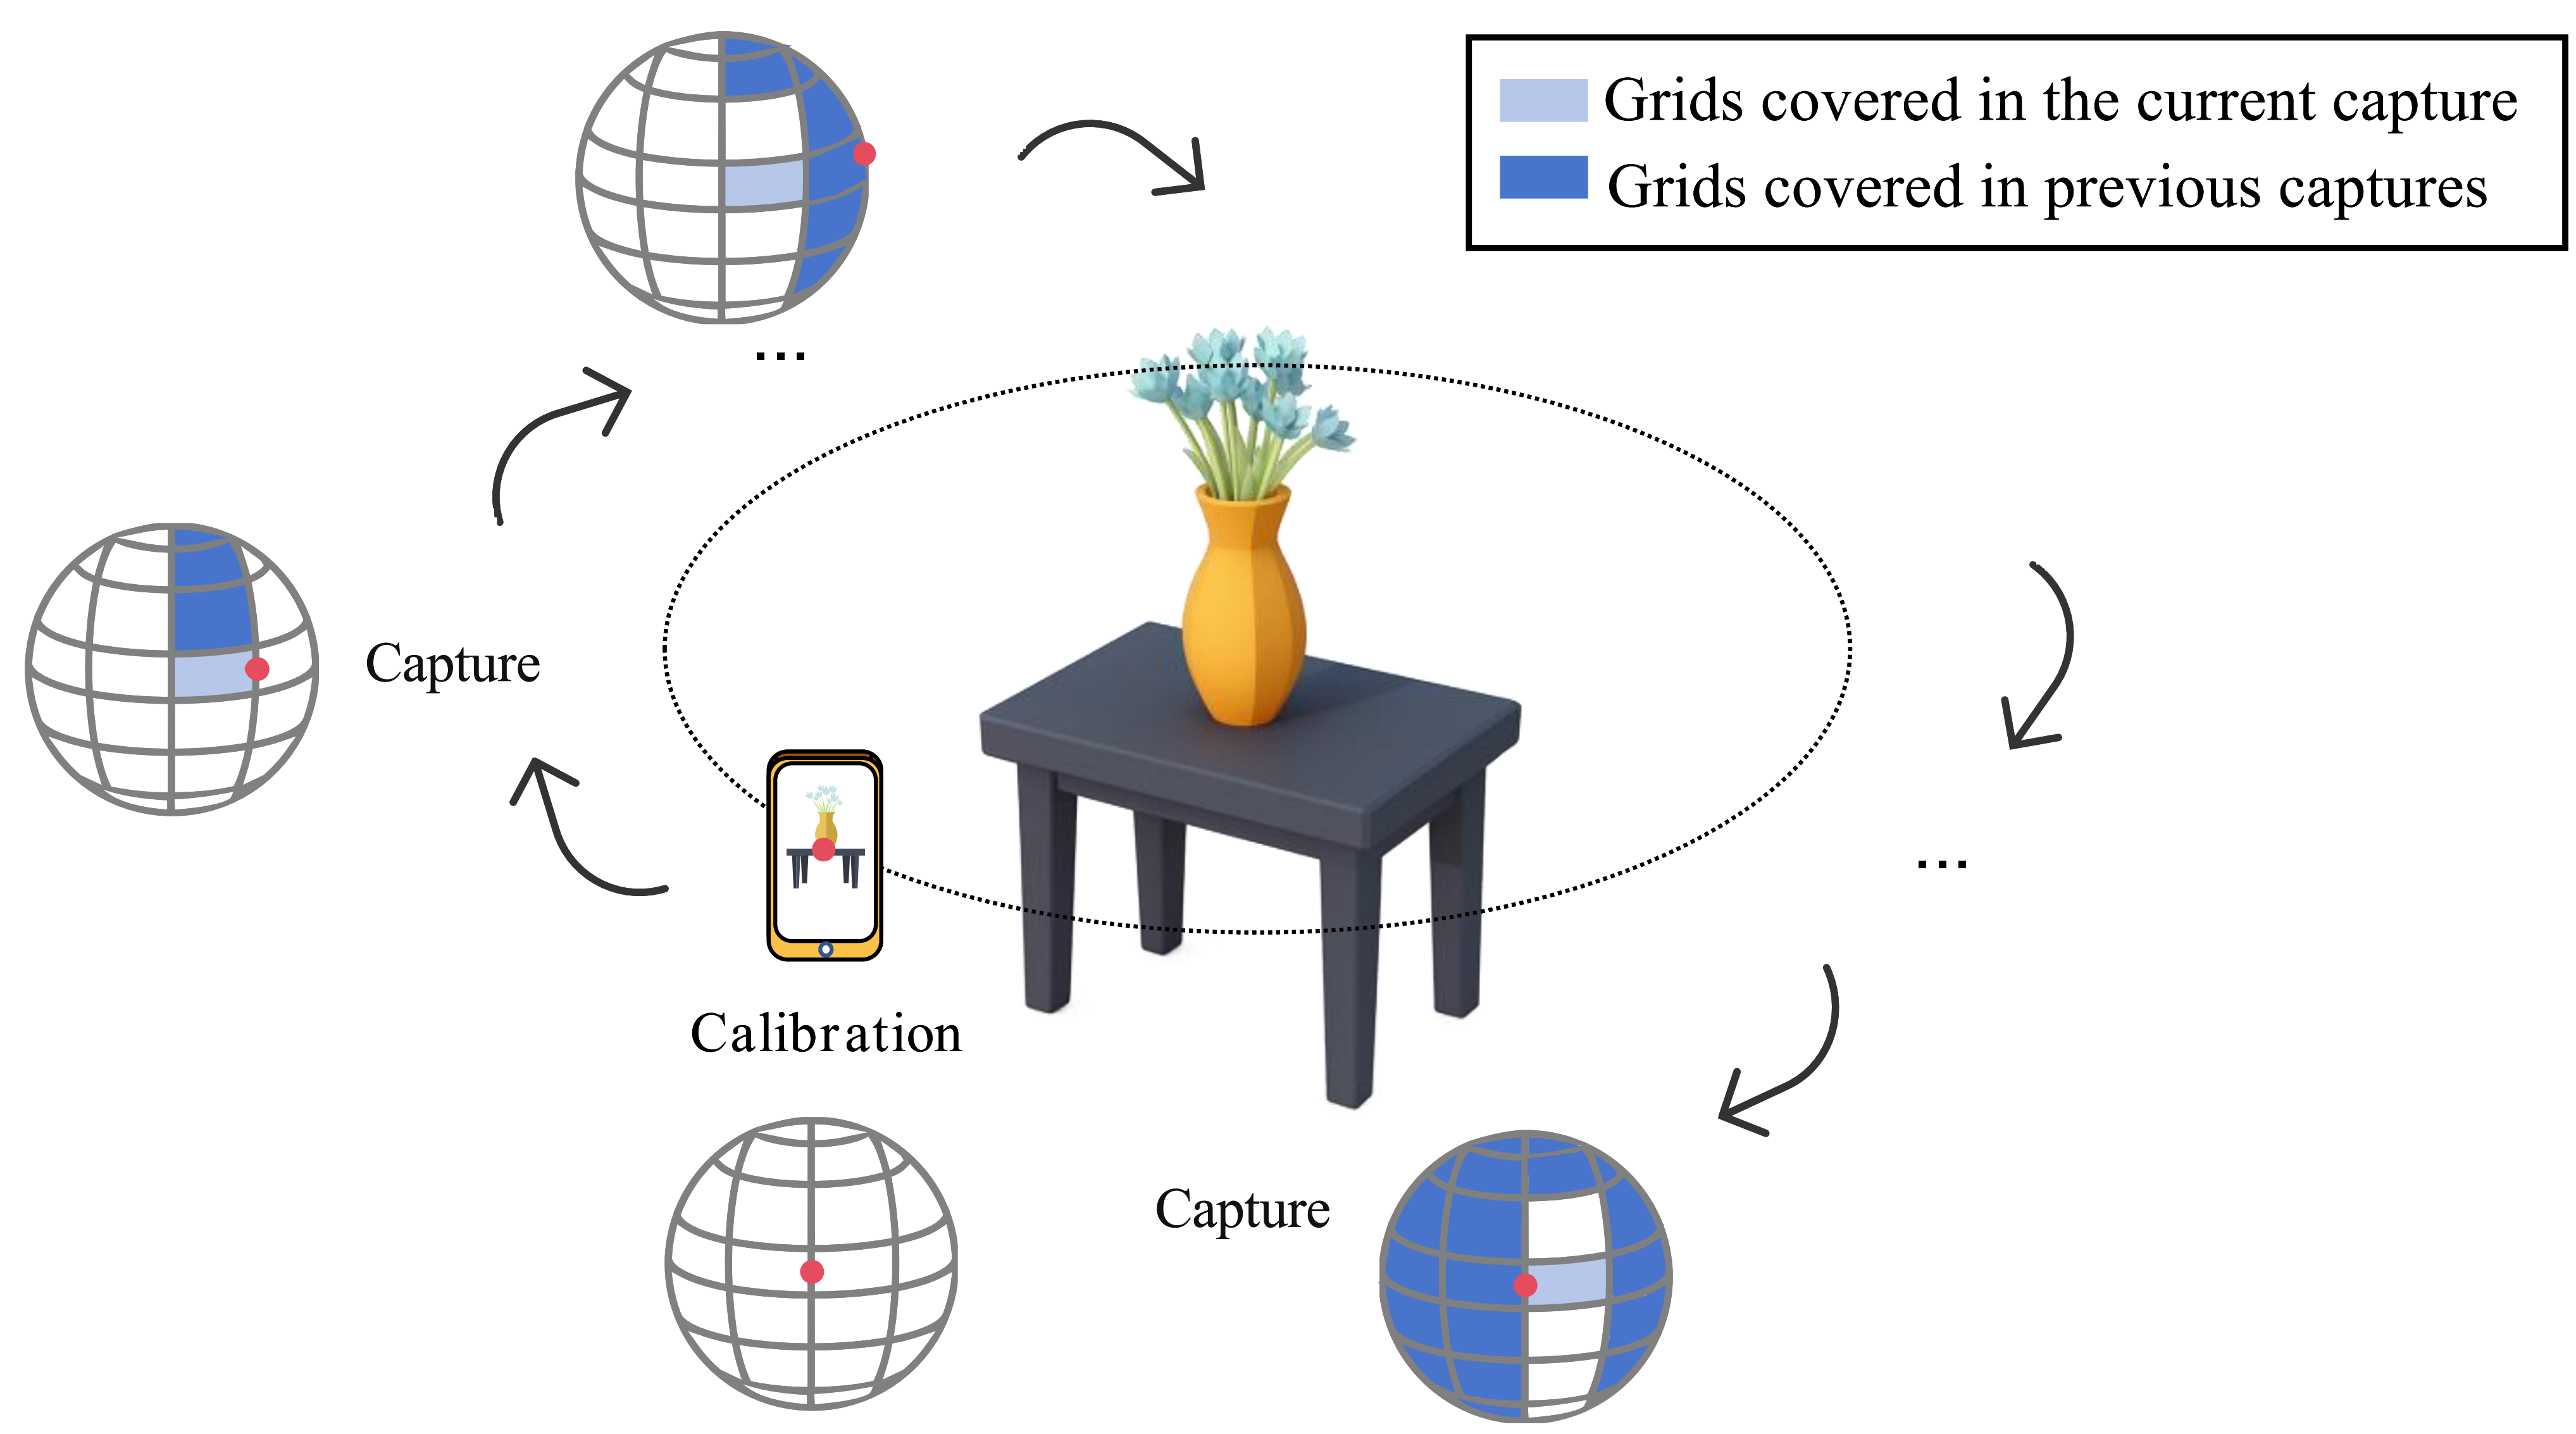
High-quality 3D Gaussian Splatting (3DGS) reconstruction relies heavily on accurate poses and comprehensive viewpoint coverage. We present a mobile, object-centered data acquisition framework that addresses these challenges through on-device guidance and sensor fusion. Our system maps the camera's optical axis to a discretized spherical grid after a one-time calibration. By providing real-time, area-weighted coverage feedback and employing a stability gate based on smoothed IMU signals, we ensure that users capture uniform, blur-free images essential for high-fidelity reconstruction.

💡

Key Contributions

⚙️

Experimental Setup

🖼️

System Overview & Demonstration

System Workflow Diagram
Figure 1. System Workflow. From calibration to stability gating, spherical mapping, and real-time coverage updates.

Dataset Objects: The following objects were used to validate our method (miniclawmachine, bearplanter, terracotta warrior replica, coinbank).

Object 4 Object 1 Object 2 Object 3
Real-time Guidance Interface: The screen recordings below demonstrate the mobile app in action. Note the spherical grid overlay filling up as the user orbits the object, ensuring no view is missed.
Capture UI — Bearplanter
Capture UI — Terracotta Warrior
Reconstruction Results: Comparison between the capture process (left) and the final 3DGS rendering (right). Full datasets and models are available for download here.
Capture Process — Miniclawmachine
3DGS Render — Miniclawmachine
Capture Process — Coinbank
3DGS Render — Coinbank
📊

Quantitative Evaluation: Free vs. Guided Capture

We conducted a user study comparing unguided "Free Capture" against our "Guided Capture" method. Table 1 highlights that while free capture often results in uneven distribution (biased towards frontal views), our guided method achieves 100% spherical coverage with comparable or fewer images, leading to consistently higher PSNR. (Raw data available here).

Table 1. Photo count, coverage distribution, and PSNR comparison (Free vs. Guided).
Method / ID Front (-45°–45°) Right (45°–135°) Back (135°–-135°) Left (-135°–-45°) PSNR (dB)
ImgCovImgCovImgCovImgCov7k30k
Free (User 1)12373%2544%5140%4252%25.9228.77
Free (User 2)9069%5057%7952%7073%25.2326.95
Free (User 3)10948%6361%4657%8148%26.8628.89
Free (User 4)6365%7151%5032%7452%25.6726.81
Free (User 5)9261%8860%9352%5761%25.6127.02
Free (Avg)9563%5955%6447%6557%25.8627.69
Ours (Guided)82100%53100%63100%60100%26.7830.28
📐

Pose Accuracy Analysis

Note: This section supplements the manuscript with additional experimental data not included in the main text due to space constraints.

To evaluate the utility of our IMU-based orientation estimates, we compared standard 3DGS training (using COLMAP poses) against a hybrid approach where COLMAP rotations are replaced by our device-calibrated orientations. Table 2 shows that our object-centered orientations yield consistent PSNR improvements, particularly in the early training stages (7k steps).

Table 2. PSNR improvement using IMU-aligned orientations vs. Original COLMAP poses.
Scene Trial COLMAP (Origin) Ours (Hybrid) Improvement (Avg)
7k30k7k30k
miniclawmachine124.9527.5725.1227.637k: +0.59%
30k: +0.02%
224.8227.5725.0027.68
325.0327.7425.1227.59
avg24.9327.6325.0827.64
bearplanter126.7028.6826.8128.667k: +0.25%
30k: +0.10%
226.7328.7126.7428.64
326.7228.6426.8028.81
avg26.7228.6726.7828.70
coinbank_bear126.3528.4526.4228.497k: +0.40%
30k: +0.01%
226.3628.5026.4628.53
326.2928.4426.4428.38
avg26.3428.4626.4428.46
📉

Supplementary Ablation Study: Impact of Coverage

Note: This section provides supplementary experimental data not included in the main manuscript.

To quantitatively validate the relationship between view coverage and reconstruction fidelity, we conducted an ablation study where training views were progressively removed from a complete (100% coverage) dataset. We maintained a fixed set of "Test" images to ensure a consistent evaluation baseline (Final PSNR).

Observation: As shown in Tables 3 and 4, there is a clear, monotonic downward trend in reconstruction quality (Final PSNR) as the spherical coverage percentage decreases. This degradation confirms that high-density spherical coverage—specifically in traditionally under-sampled regions—is a critical factor for robust 3DGS reconstruction.

Table 3. Ablation on Coinbank: PSNR trends vs. Coverage %.
Coverage Test 7k Test 30k Train 7k Train 30k Final 7k Final 30k
100%26.0027.3129.0131.4526.3927.84
90%25.7826.7729.0131.0526.2027.32
80%25.5426.4828.6531.4225.9427.12
70%25.3826.2029.1931.6725.8726.90
60%25.0525.4829.4832.3425.6126.36
50%24.5224.8529.5433.2425.1725.93
40%23.4323.5830.5334.4724.3424.98
Table 4. Ablation on Miniclawmachine: PSNR trends vs. Coverage %.
Coverage Test 7k Test 30k Train 7k Train 30k Final 7k Final 30k
100%24.7126.2225.9429.1624.8726.60
90%24.2025.3325.6828.5324.3925.74
80%23.9824.8726.1528.9524.2525.39
70%24.1725.0126.4429.9924.4625.65
60%23.6724.2726.6630.3724.0525.05
50%20.0119.9330.7534.5821.3921.81
40%21.3521.2528.4832.7722.2622.72

* Note: For brevity, intermediate 5% intervals are omitted from the web view but are available in the full dataset download.

⬇️

Resources

🤝

Acknowledgements

This project builds upon 3D Gaussian Splatting and the Fossify Camera open-source project.